
COVID map shows latest case rates across US
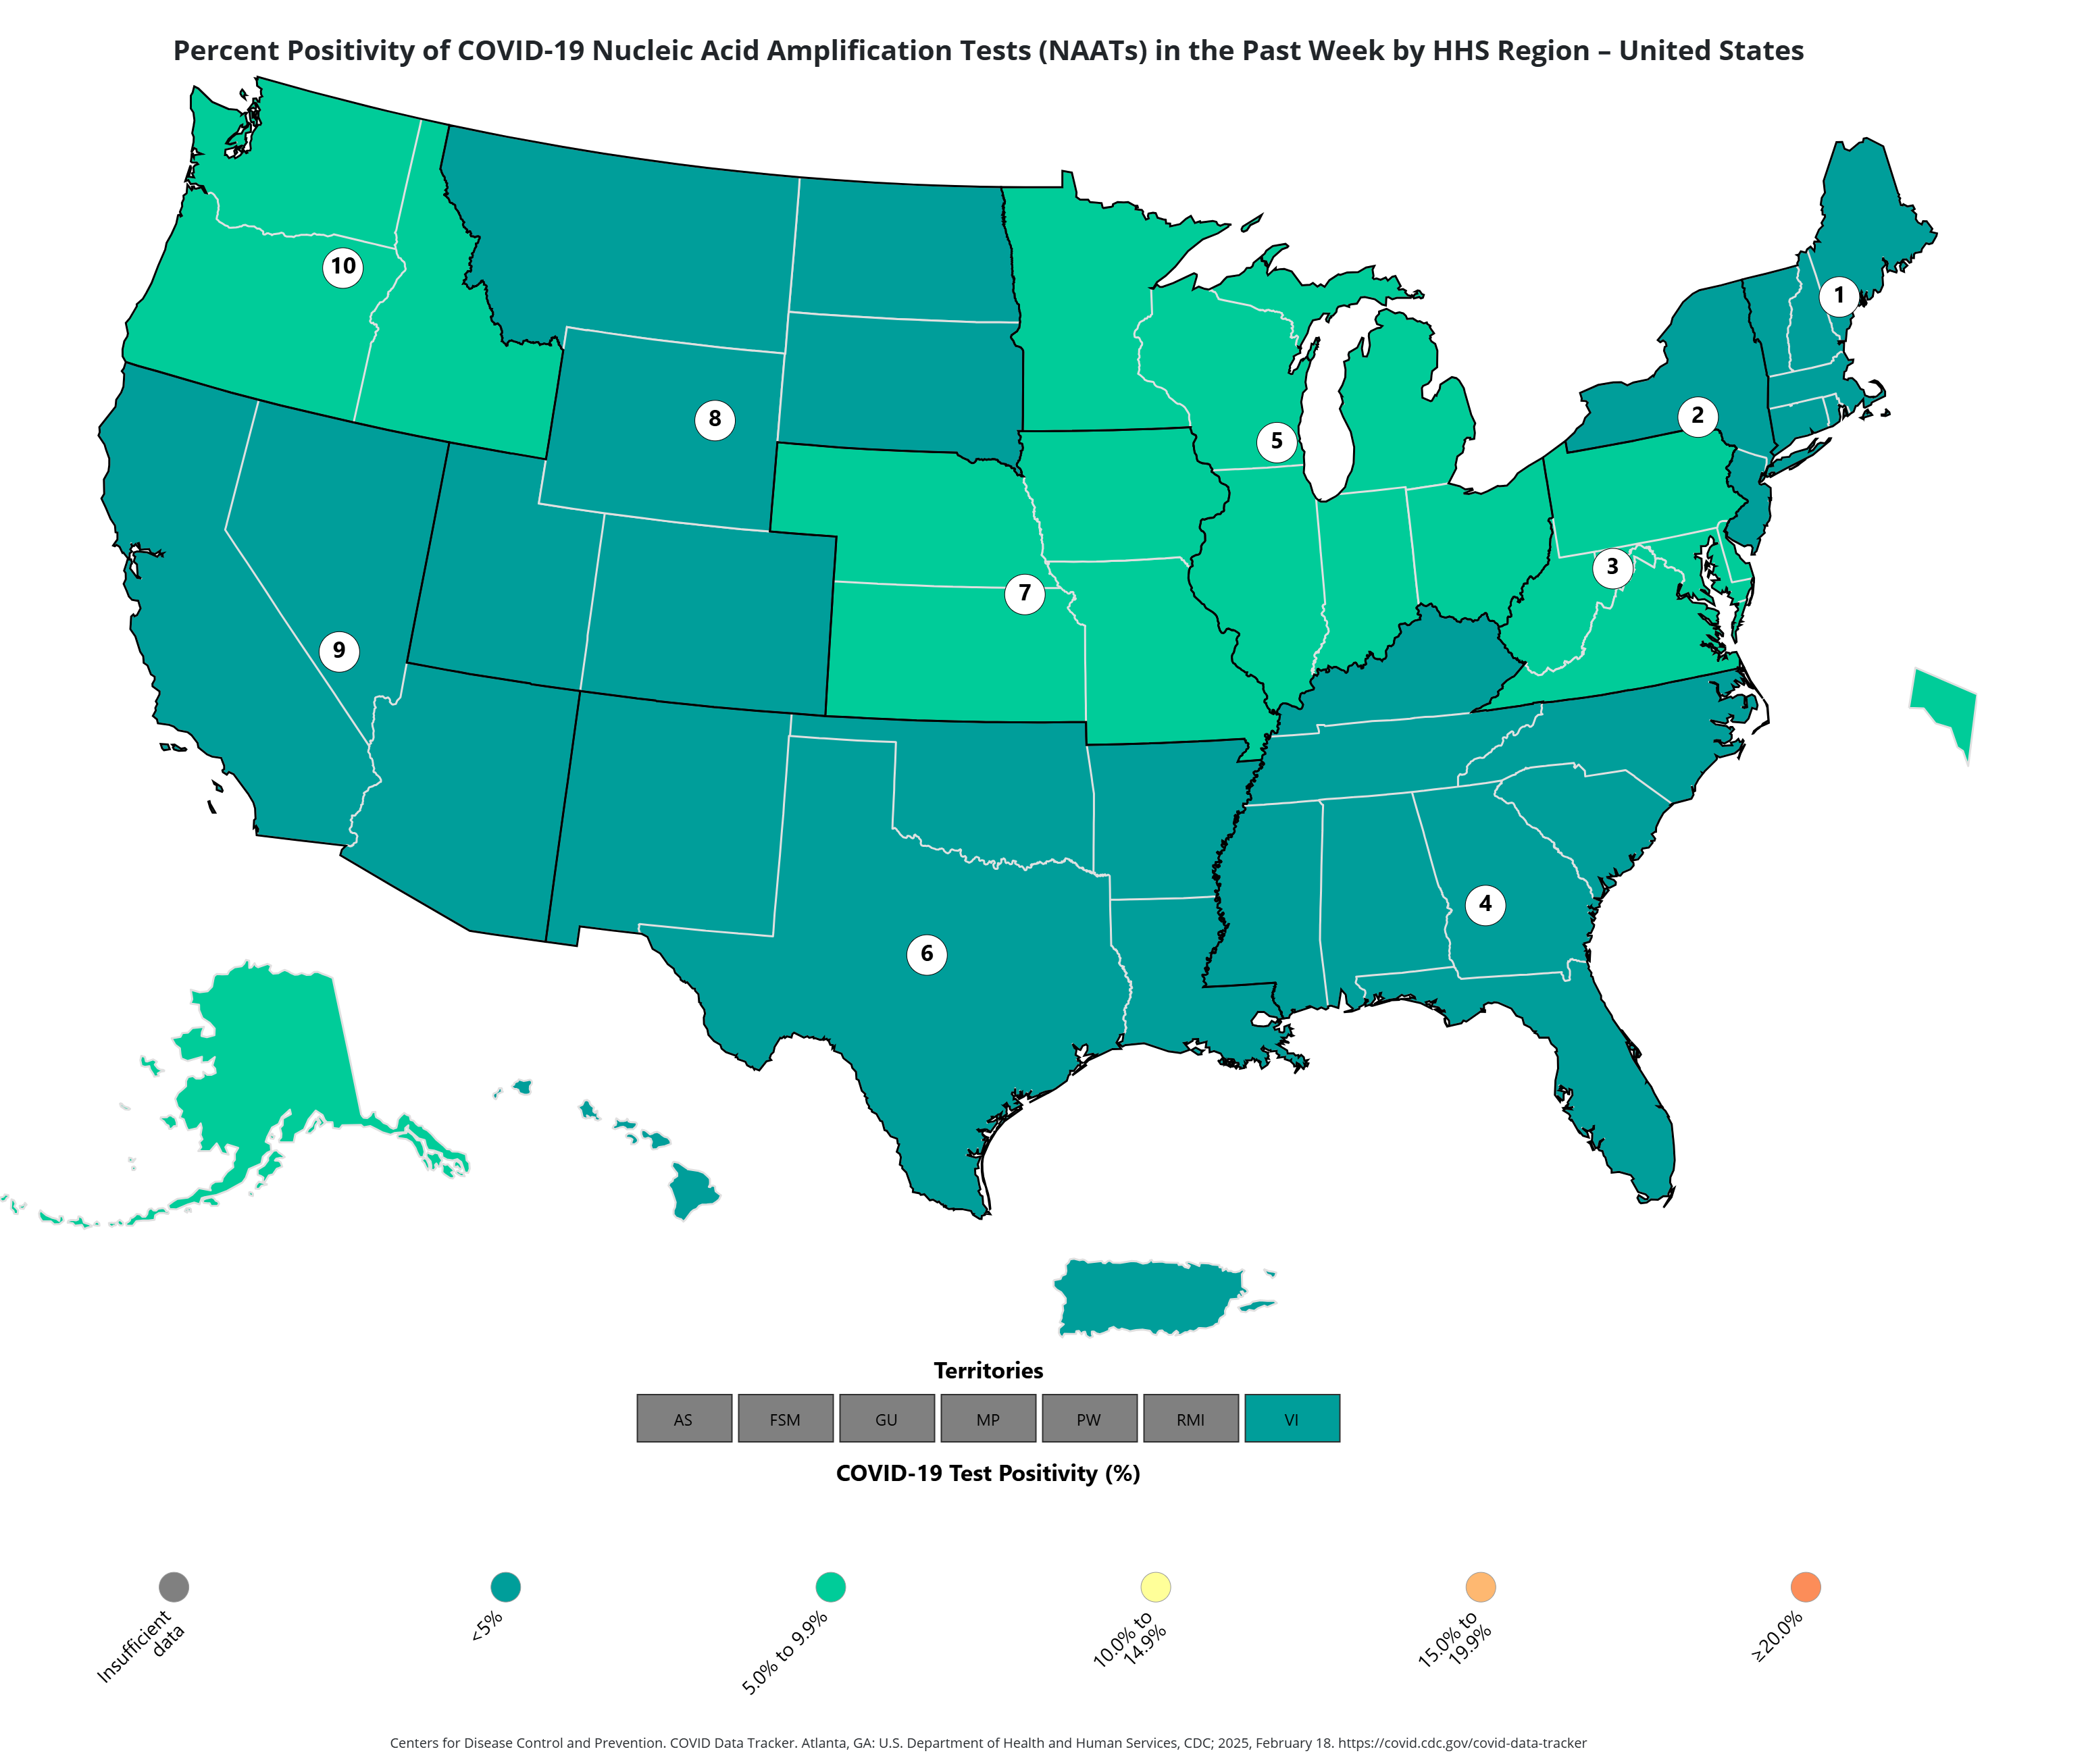
Washington, Oregon, Idaho and Pennsylvania are among the states with the highest COVID-19 test positivity rate, new data shows.
Why It Matters
The U.S. is struggling with an unprecedented spread of illnesses, with COVID-19 one of them, along with influenza, respiratory syncytial virus (RSV) and norovirus, in what a doctor has called a "quad-demic."
The U.S. Centers for Disease Control and Prevention (CDC) has reported an increase in visits to doctors on a scale not seen in 15 years.
What To Know
Test positivity measures the percentage of COVID-19 tests that return positive results and are usually used to gauge the level of spread.
Nationally, the test positivity rate for the week ending on February 8, was 4.8 percent, according to the CDC's most recent update on its COVID Data Tracker.

Regions 10 (Alaska, Washington, Oregon and Idaho), seven (Nebraska, Iowa, Kansas and Missouri), five (Minnesota, Wisconsin, Illinois, Michigan, Indiana and Ohio) and three (Pennsylvania, West Virginia, Virginia, Delaware and Maryland) had the highest test positivity.
The rate of positivity for each region was between 5 percent and 9.9 percent, the CDC map shows.
Together, Alaska, Washington, Oregon and Idaho's test positivity was 6.9 percent, while Nebraska, Iowa, Kansas and Missouri's combined was 5.1 percent.
Minnesota, Wisconsin, Illinois, Michigan, Indiana and Ohio's was 5.4 percent and Pennsylvania, West Virginia, Virginia, Delaware and Maryland's were 5 percent.
The rest of the country was in the next category, with a test positivity rate of less than 5 percent.
The region with the lowest test positivity includes Arizona, California, Hawaii and Nevada, with 2.9 percent.
What People Are Saying
Dr. Ryan Fulton, section chief of general pediatrics at Carilion Children's Hospital and faculty member at the Virginia Tech Carilion School of Medicine, told Newsweek: "The reason this year is seeing more aggressive outbreaks is really a perfect storm of circumstances.
"Throughout the pandemic, we had an interruption in the normal course of circulation of flu and RSV, so some people—especially little kids—haven't built up the same degree of protection they would in normal times.
"And then to add insult to injury, these viruses are behaving unpredictably post-pandemic, with shifts in seasonality and severity."
Flu Map Shows Highest Levels Across US
Newsweek has also covered the prevalence of influenza around the country, looking at the states reporting people with the highest number of influenza-like illness (ILI) symptoms.
The states that have seen the most doctor visits (rated "very high" by the CDC) in the week ending February 8 include Washington, Oregon, Nebraska, Kansas, New Mexico, Michigan, Ohio, Tennessee, South Carolina and Virginia, according to the CDC's Influenza Surveillance Report map.
It also includes Massachusetts, New Hampshire, New York City, Texas, Oklahoma, Arkansas, Louisiana, North Carolina, Georgia, Indiana, Missouri, Iowa, Illinois, Wisconsin and Maine.
What Happens Next
Health officials will continue to monitor sickness levels in the country, including COVID-19. The CDC recommends that everyone over the age of 6 months is vaccinated against COVID-19 and that people stay up to date with these vaccines, particularly the elderly and immunocompromised.